I. The Direct Cost Push Behind This PCB Price Surge
The primary logic behind the PCB price surge is a genuine sharp rise in upstream raw materials. In the PCB cost structure, Copper Clad Laminate (CCL) accounts for about 40% of total cost. Within CCL, copper foil, resin, and glass fiber fabric (glass fabric) account for 39%, 26%, and 18% respectively. In other words, price changes in these three components are first amplified at the CCL level and then transmitted to PCBs.
- Platform-like rise in copper prices: The increase in international copper prices is not a one-time pulse but a sustained, high-level “platform ascent”. The monthly average price rose from USD 8,978/ton at the beginning of 2025 to USD 13,089/ton in January 2026. This means CCL manufacturers are not facing short-term fluctuations but must systematically pass on a higher cost base.
- Structural shortage of glass fabric: This is an even more critical variable than copper prices. Since Q4 2025, the price of electronic glass fabric has accelerated. This is because major glass fabric manufacturers have shifted significant capacity to high-margin Low-Dk, Low-CTE, and Q‑cloth (quartz fabric), causing simultaneous supply tightness for both mid‑low‑end ordinary fabric types and high‑end ones.
- Moderate resin price increases and specification upgrades: Traditional FR‑4 systems mostly transmit cost increases, but benefiting from demand for high‑end M8/M9/M10 systems, the added value of high‑end systems such as hydrocarbon resin and PPO/PTFE is increasing more noticeably.
II. Why Is This Time “Costs Up, Prices Up, Profits Also Improving”?
In the past, the PCB industry was highly competitive, and cost increases did not always translate smoothly into price quotes. But in this round, pricing power has partially shifted from downstream customers back to tier‑1 CCL/PCB manufacturers. The key reasons:
- High concentration of the CCL industry: The top‑10 (CR10) market share in the PCB industry is less than 40%, but the CR10 in the CCL industry is as high as 77% (e.g., EMC, Iteq, Kingboard). High concentration means that when raw material prices rise across the board, leading CCL manufacturers can more easily reach an industry‑wide consensus on price hikes.
- High‑end PCB capacity utilization is at full load: Entering 2026, high‑end capacity utilization of tier‑1 PCB manufacturers on both sides of the strait is generally above 93%–97%, with order visibility often exceeding three months.
- AI products crowding out conventional capacity: Products such as AI servers and 800G switches have high unit prices and complex processes. Given limited equipment resources, large manufacturers prioritize capacity for high‑margin orders, forcing mid‑low‑end products to raise prices because “remaining capacity is insufficient”.

III. AI Demand Is the True “Core Amplifier” of This Price Surge
What is truly pushing the industry into a new growth cycle is the “volume and price increase” brought by AI.
- Demand multiplication: AI server PCB demand is expected to grow from 0.9 million m² in 2025 to 2.5 million m² in 2027 (CAGR 69%).
- Average selling price (ASP) leap: AI server PCB ASP is expected to rise from USD 5,511/m² in 2025 to USD 11,062/m² in 2027; AI CCL ASP from USD 90/sheet to USD 239/sheet.
AI brings not just “more servers” but a simultaneous leap in per‑rack specifications, layer count, and material grade. This is the real foundation for the sustainability of PCB price increases.
IV. The Unit Price Leap Brought by Specification Upgrades
The PCB upgrade in the AI era essentially means: higher signal transmission rates, stricter thermal management, and more layers.
- The industry is accelerating from M6/M7 to M8/M9, and even testing M10.
- Layer count is upgrading from 20‑26 layers to more than 30 layers; HDI from 5L to 6L+.
- Materials are moving from ordinary glass fabric to Low‑Dk, Q‑cloth, T‑glass; copper foil to HVLP4/5.
According to industry data, the unit price of M9‑grade CCL can exceed USD 400/sheet, while M7 is about USD 100‑110. Upgrading from M7 to M9 is not a fine‑tuning; it is a near‑multiple leap in output value.
V. Why Has This Price Surge Spread from High‑End to Mid‑Low‑End?
Because the bottleneck in high‑end materials and capacity has begun to “reverse‑drain” mid‑low‑end resources.
Currently, not only are high‑end materials in short supply, but even the lead time for ordinary E‑glass fabric has extended to more than 10 weeks. The situation is similar for copper foil: low‑end capacity is shifting toward HVLP4. This has raised the entire CCL/PCB supply curve. Mid‑low‑end products, which originally had lower margins and are more sensitive to costs, have seen even larger rebounds in this price increase cycle.
VI. Hard Evidence That Price Increases Have Landed
This is not a capital market expectation but actual supply chain actions:
- Japanese major manufacturers: Resonac announced a price increase of more than 30% for CCL and prepreg effective March 1; Mitsubishi Gas Chemical (MGC) raised prices by 30% effective April 1.
- Greater China: Leading manufacturer Kingboard has made multiple price adjustments since the second half of 2025. In March 2026, it again increased processing fees for all laminates, prepregs, and copper foil by 10%.
VII. The “Critical Bottleneck Materials” That Define the Ceiling: T‑glass / Q‑cloth / HVLP4
If copper prices determine cost flexibility, then T‑glass, Q‑cloth, and HVLP4 copper foil determine the supply ceiling.
Take T‑glass as an example: expanding capacity is not just a matter of buying equipment; it also involves a long process of drawing, weaving, and customer qualification. Nittobo’s new capacity in Taiwan is expected to start producing yarn in the second half of 2026, but conversion to fabric delivery will most likely be in the first half of 2027. It is estimated that the T‑glass supply‑demand gap will be about 20% in 2026, the Q‑cloth gap could reach 25%–30%, and the HVLP4 gap about 37%. These “critical bottleneck” materials are an absolute constraint that keeps prices persistently strong.
VIII. Will Prices Continue to Rise? Three‑Level Judgment of the Trend
- Through 2026, the price center remains strong: A new round of price increases has already landed in Q2. Benefiting from the traditional peak season and accelerated AI pull‑ins in Q3, the upward trend is very likely to continue.
- The sustainability of price increases for high‑end materials is much stronger than for mid‑low‑end: Products with long‑term pricing logic are M8+/M9 CCL, 30+‑layer high‑end boards, 6L+ HDI, etc. These categories have high technical thresholds and slow yield ramps; alternative supply is extremely unlikely in the short term.
- After 2027, watch for “structural divergence”: As capital expenditures (Capex) by various manufacturers take effect, the market will shift from “general price increases” to “divergence” after 2027. Only manufacturers with truly high‑end mass‑production yields will be able to maintain high gross margins.
IX. Three Key Observation Points and Potential Risks for the Subsequent Trend
Three key observation points:
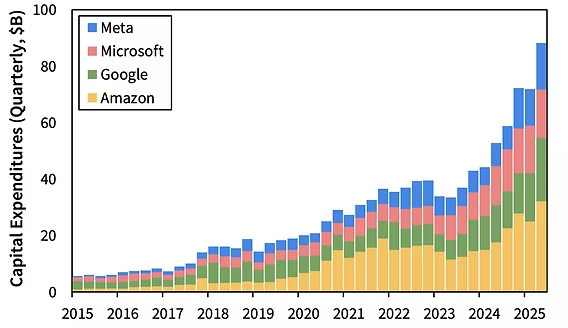
- Whether AI Capex continues to ferment: In 2026, North American cloud giants (CSPs) are still optimistic about AI Capex (up to USD 550 billion). However, if subsequent commercialisation falls short of expectations, it will directly affect high‑end PCB demand.
- When the critical material gaps will ease: As long as T‑glass, Q‑cloth, and HVLP4 remain tight, it will be difficult for the industry to see a significant price drop.
- Capacity expansion progress and yield ramp‑up: The expansion cycle for high‑end PCBs typically takes 18‑20 months, and yields are naturally lower than for traditional products. The speed of effective supply release is key.
Risks to watch:
- Changes in technology roadmap: For example, the evolution of silicon photonics (CPO), advanced packaging (CoWoS/CoWoP), or changes in near‑package optics or backplane solutions could reshape the value distribution across different PCB sub‑segments.
- Too rapid capacity release after 2027: If leading manufacturers concentrate their high‑end capacity expansion while AI demand growth slows, price elasticity will decline significantly.
Summary
The PCB price increase follows a complete transmission chain: raw material price rise → CCL price adjustment → AI demand drains high‑end capacity → high‑end products surge → conventional capacity is crowded out → mid‑low‑end products are forced to follow. Looking at the timeline:
- Full year 2026: Expected to remain within the price increase cycle, with a strong price centre.
- Second half of 2026 – first half of 2027: High‑end materials, high‑end CCL, and high‑end PCBs still have strong support.
- After 2027: The industry will move from “general price increases” to “divergence”. Close attention must be paid to yield improvements and the actual contribution of AI demand.
Professional Support from eCloud
In this wave of supply chain volatility and technology iteration, locking in capacity and high‑quality materials early is the key to success. With its deep industry resources and technical collaboration with top academic and research institutions both domestically and internationally, eCloud provides you with the most solid PCB solutions. From securing high‑frequency, high‑speed top‑tier materials like M8/M9 to professional DFM evaluation during the prototyping phase, eCloud helps you achieve the best balance between budget and performance, ensuring your AI and high‑end projects land on schedule!